Bitcoin Likely to Become More Volatile After Entering $70K–$80K 'Air Pocket'

Bitcoin Likely to Become More Volatile After Entering $70K–$80K 'Air Pocket'
Low supply concentration in this range may lead to heightened volatility.
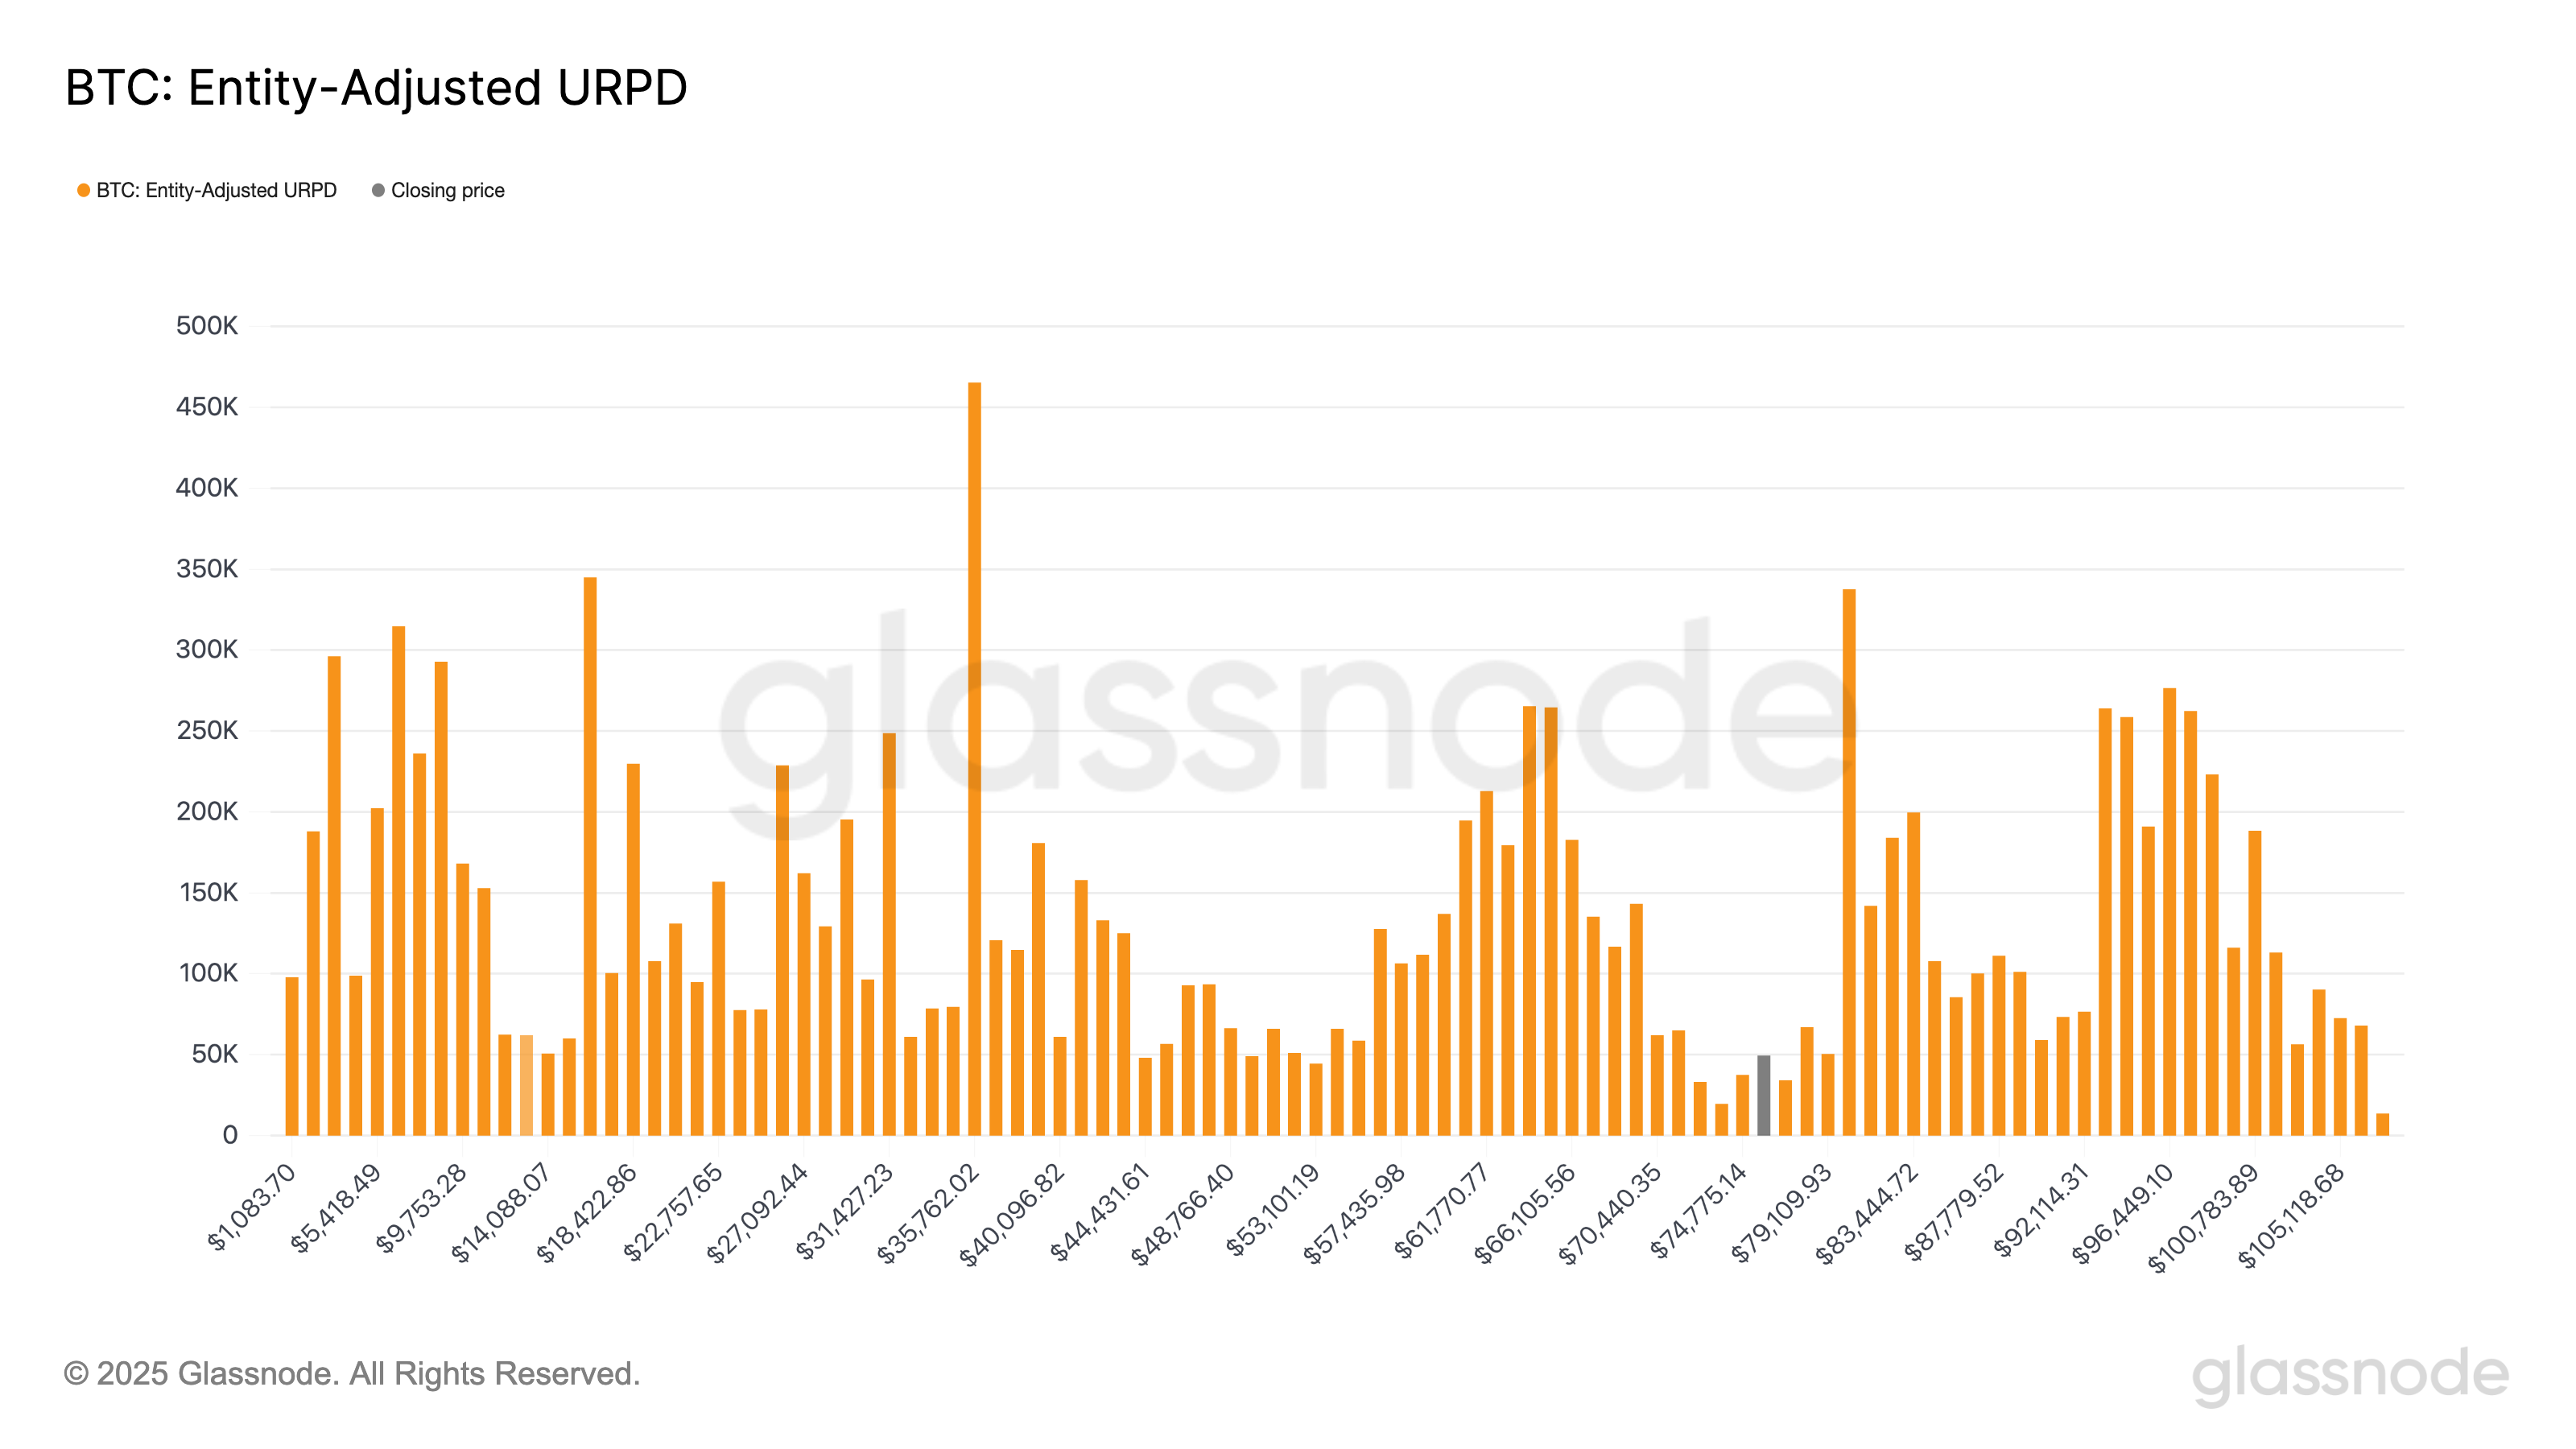
- Less than 2% of bitcoin's supply exists between $70,000 and $80,000, creating a thin liquidity zone known as an "air pocket."
- Historically, bitcoin tends to revisit and consolidate in previously skipped price ranges before establishing a new trend.
- Approximately, 25% of the bitcoin supply is sitting at a loss.
Bitcoin is anticipated to experience increased volatility as it hovers within the $70,000–$80,000 range, termed an "air pocket" due to the low concentration of supply in this price bracket.
A mere fraction, less than 2%, of the total bitcoin supply lies between $70,000 and $80,000, setting the stage for potential erratic price movements. This phenomenon is not uncommon for bitcoin as it has historically shown a pattern of revisiting and consolidating in previously skipped price levels before embarking on a new trajectory.
The current scenario depicts approximately 25% of all bitcoins being held at a value lower than their acquisition cost. This situation is particularly prevalent among short-term holders who made purchases within the past 155 days. These dynamics are reflected in Glassnode's analysis which highlights the existence of an "air pocket" between $70,000 and $80,000 that emerged post a surge in bitcoin prices following the election victory of former President Donald Trump.
Analyzing bitcoin's unspent transaction output (UTXO) can provide insights into these market conditions. The UTXO Realized Price Distribution (URPD) offers a breakdown of when bitcoin was last moved based on its acquisition price. This information sheds light on the distribution of holdings across different price points.