Chart of the Week: Wall Street's 'Fear Gauge' Is Flashing Possible Bitcoin Bottom


Chart of the Week: Wall Street's 'Fear Gauge' Is Flashing Possible Bitcoin Bottom
The bitcoin to VIX ratio might be signalling a potential long-term bottom for BTC price.
- The S&P Volatility Index has surged to its highest level since last August, indicating increased market uncertainty.
- The bitcoin to VIX ratio has hit a long-term trendline, historically suggesting a potential bottom for bitcoin prices.
- This trendline has previously marked the bottom for bitcoin during major market events, followed by price rallies.
This Week's Highlight: Signals Point to Bitcoin's Potential Rebound as Wall Street's 'Fear Gauge' Raises Eyebrows
There might be hope on the horizon for Bitcoin as a potential long-term rebound could be on the cards, indicated by the bitcoin to VIX ratio.
Market uncertainty has been on the rise with the S&P Volatility Index reaching its highest level since August of last year, highlighting a surge in market unpredictability.
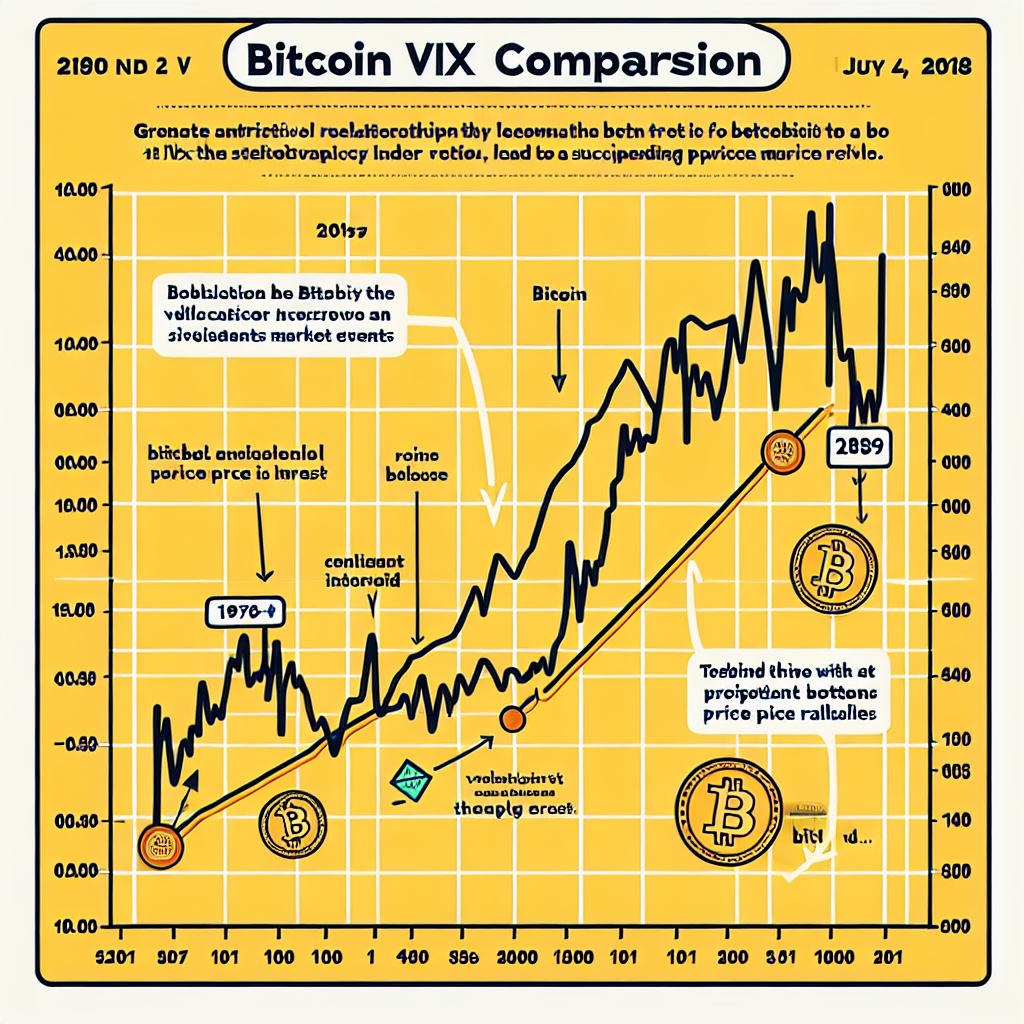
The bitcoin to VIX ratio has recently aligned with a significant long-term trendline, historically hinting at possible price bottoms for Bitcoin. This trendline has proven to be a pivotal point during major market events in the past, leading to subsequent price surges.

Despite recent turbulence in financial markets triggered by uncertainties surrounding President Donald Trump's tariffs starting on April 3rd, various assets have experienced pronounced fluctuations. Gold prices have soared to record highs, while the DXY Index dropped below 100 for the first time since July 2023, creating an atmosphere of unease across equities and bond markets.
Of particular interest is how the S&P Volatility Index (VIX), often regarded as Wall Street's "fear gauge," has spiked to levels not seen since last August. What sets this situation apart is its implications for Bitcoin.